Execution Information Perspective
Icon: ![]()
Description
The Execution Information perspective provides an overview of execution information for previously executed workflows and pipelines. The perspective allows you to browse the list of executions and drill up or down to parent or child workflows and/or pipelines. Additionally, this perspective provides information about the execution status, logging information, (pipeline) metrics and the profiled data.
Information collection
The execution information displayed in this perspective is not collected automatically. You need to specify to which location you want to send execution information in the Pipeline run configuration or Workflow run configuration of your choice.
Navigation
You can navigate to it by clicking the ![]() icon from the vertical perspective toolbar in the Hop GUI.
icon from the vertical perspective toolbar in the Hop GUI.
The Keyboard shortcut to do the same is: CTRL-Shift-I.
If you want to view information regarding the last execution of the currently loaded pipeline (from the data orchestration perspective), you can hit the location icon in the toolbar:
If you’re editing a workflow you can do the same:
Usage
Left-hand side panel
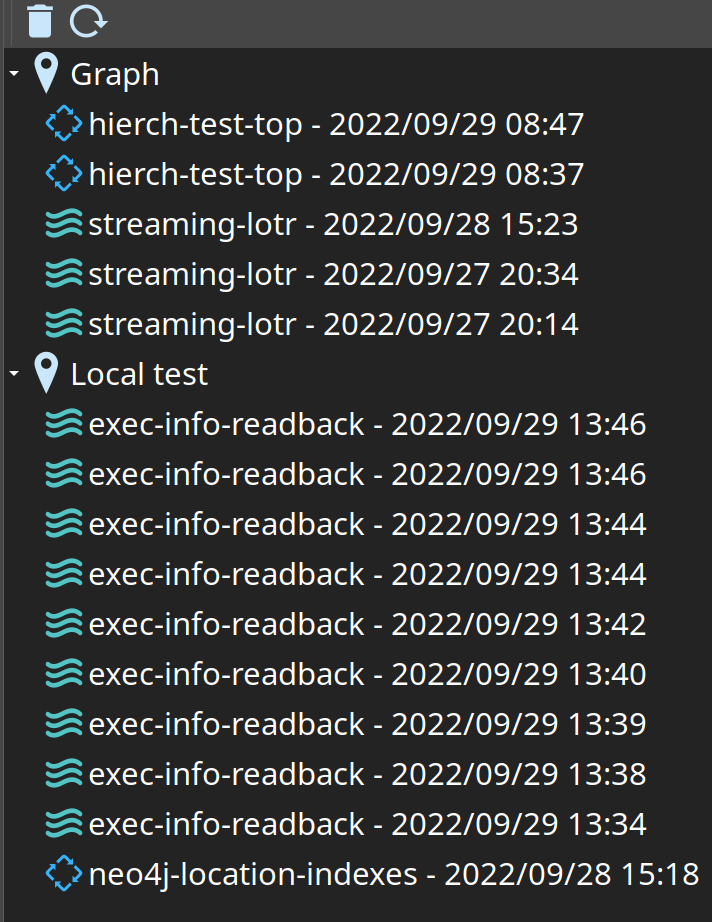
The left-hand side panel of the perspective contains a tree with all the defined Execution Information Location metadata elements. Below the names of these locations you’ll see the icon, name and registration date of the pipelines and workflow for which there is information. For example:
Possible action:
| Action | Result |
|---|---|
Double-click on a listed execution | The information about the pipeline or workflow will be loaded into a new tab on the right-hand side of the perspective. |
Click on the refresh icon | The last 100 executions without parent will be loaded from the location |
Click on the delete icon | The currently selected execution will be deleted or all executions from the currently selected location (after confirmation). |
Right-hand side tab folder
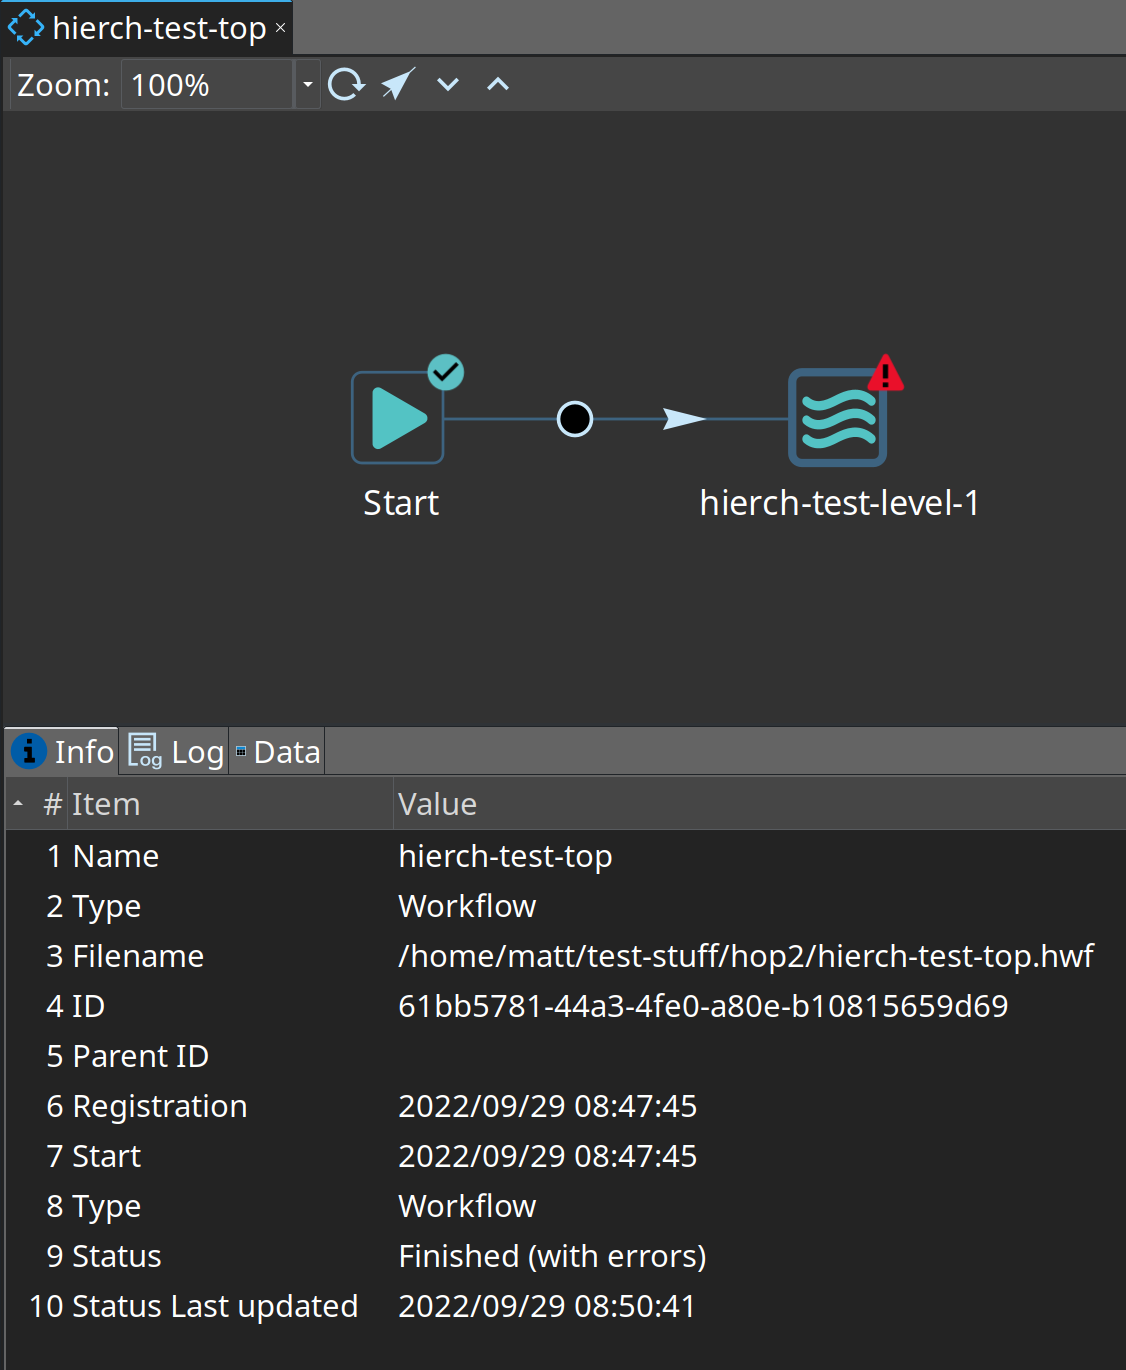
On the right side are the executions opened in different tabs. For example, here is a single execution information tab of a completed workflow:
At the bottom you have different tabs:
| Tab | Description |
|---|---|
Info | Here you’ll find general information regarding the pipeline or workflow you’re looking at |
Metrics | In case you’re examining a pipeline execution you can see the overall transform metrics if there are any. |
Log | Here you can find the pipeline or workflow logging text |
Data | During the execution of a pipeline or workflow Hop can capture all sorts of data. Which data depends on the type of work that is being done and on how capturing is configured. For example the amount of data captured depends on the Execution Data Profile you set for a pipeline or whether of not there was interesting information after the execution of an action. |
Selecting an icon
If you click on a transform or workflow icon the perspective will automatically try to load all the data it has for it. It will switch to the "Data" tab at the bottom. There you will find a list of data sets that you can look at.
Here are available data sets for workflow actions:
| Data set | Description |
|---|---|
Result details of action | You will find out if there were any errors, what the result (true/false) was or whether the action was stopped. |
Result files of action | If the action result contains any file names they will be in this data set |
Result rows of action | If the action result contains any rows they will be in this data set |
Variables before execution | The list of interesting (different from the start of the workflow) variables before the action was executed. |
Variables after execution | The list of interesting variables (and their values) after the action was executed. |
Here are some data sets you can capture in workflow transforms using an Execution Data Profile:
| Data set | Description |
|---|---|
First rows of … | Shows the first rows that were written by the transform. |
Last rows of … | Shows the last rows that were written by the transform. |
Random rows of … | Shows a random selection of rows written by the transform |
Data profiling data sets | Depending on the data profiling options you enabled you can find per-column statistical information as well as sample rows. |
Drill down
If you want to know what went on during the execution of a particular action or transform you can select it and hit the arrow down in the toolbar:
If the transform executed a pipeline or workflow in multiple copies you can choose which execution you want to follow. The same goes for workflows or pipelines that got executed multiple times in a repeat action or a Start loop. The result will be that the underlying execution will be opened in a new tab in the perspective.