Run, Preview and Debug a Pipeline
Running a Pipeline
Running a pipeline to see how it performs can be done by completing one of the following tasks:
-
Using the Run
 icon
icon -
Select Run and Start execution from the top menu
-
Pressing F8
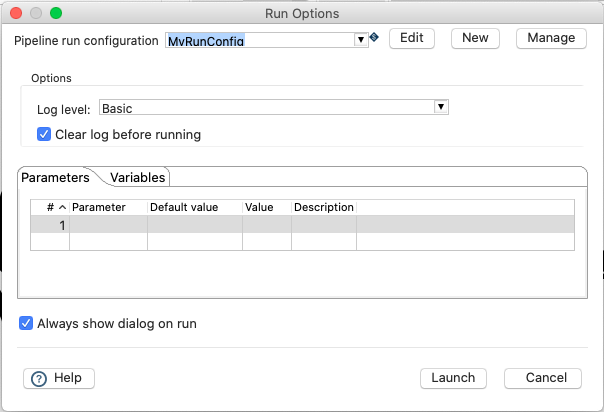
In the pipeline run dialog, hit the 'New' button in the upper right corner to create a new 'Pipeline run configuration'.
In the dialog that pops up, add 'Local Pipeline' as the pipeline configuration name and choose the 'Local pipeline engine' as engine type.
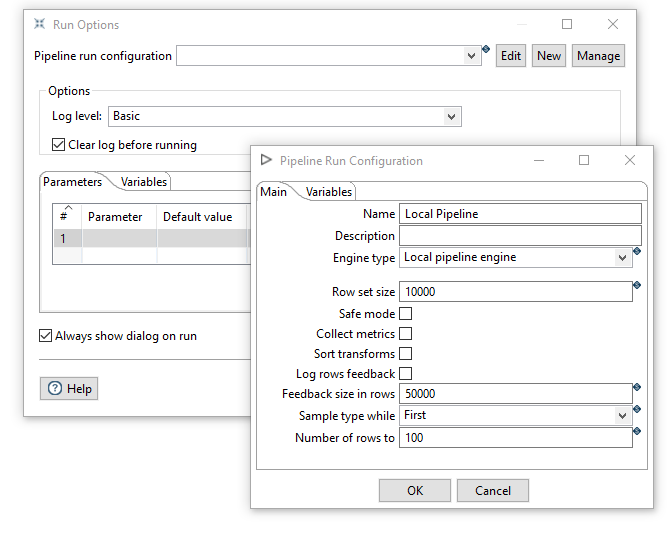
Click 'Ok' to return to the pipeline run dialog.
Choose the logging level as described below.
| LogLevel | Description |
|---|---|
Nothing | Do not record any logging output. |
Error | Only record errors in logging output. |
Minimal | Only use minimal logging. |
Basic | This is the default logging level. |
Detailed | This logging level gives a detailed logging output. |
Debugging | Results in a very detailed output for debugging purposes. |
Row Level | Logging at row level. |
Make sure your configuration is selected and hit 'Launch'.
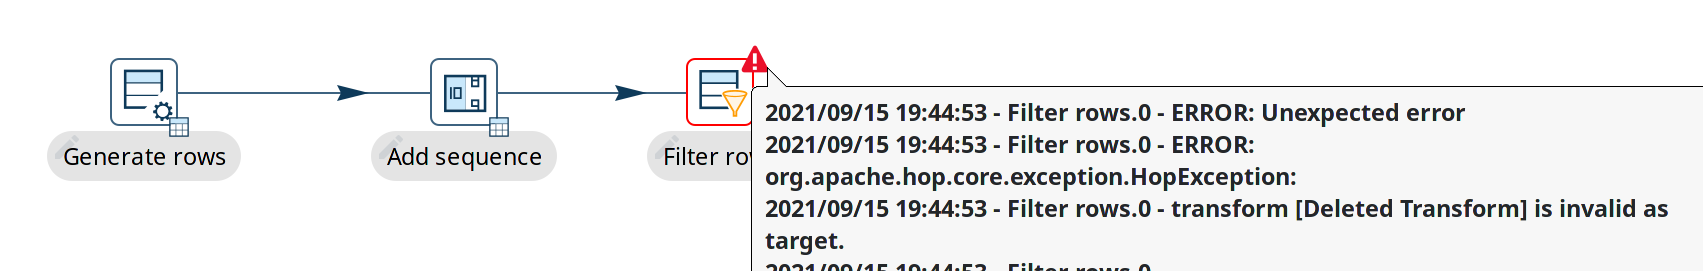
When a pipeline has run succesfully green check marks are displayed in the right upper corner on the transforms.
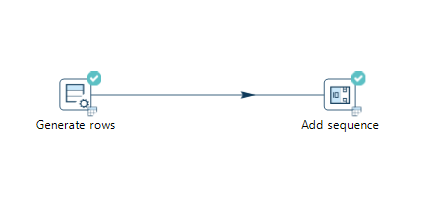
The transforms also show a little table icon, giving you access to a preview of the results of that transform.
When a pipeline fails, a red triangle is shown in the upper right corner of the failed transform. Hover your mouse over the red error triangle to take a quick peek at the error message. The full stacktrace is available in the logs. Check pipeline error handling to learn about how you can handle errors in your pipeline gracefully (which is not necessarily what you want).
After each run the execution results are displayed in the panel on the bottom of your window. The Execution Results contains two tabs:
-
Transform Metrics
-
Logging
The Transform Metrics tab displays metrics per transform.
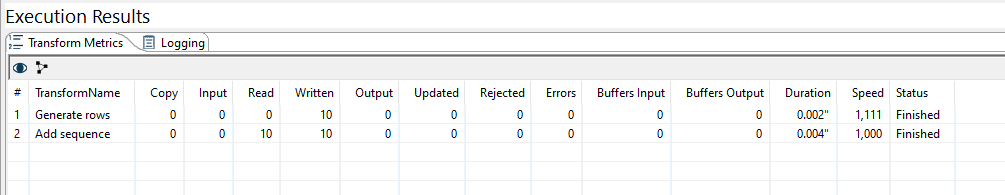
Following metrics are displayed:
| Metric | Description |
|---|---|
Copy | |
Input | Number of rows read from |
Read | Number of rows coming from previous transform |
Written | Number of rows leaving this step toward next transform |
Output | Number of rows written to a file or table |
Updated | Number of rows updated by the transform |
Rejected | |
Errors | Number of errors in the execution. The whole row is marked red if an error occurs |
Buffers Input | |
Buffers Output | |
Duration | The duration of the execution of the transform |
Speed | |
Status | The step status; Running, Stopped, Finished, |
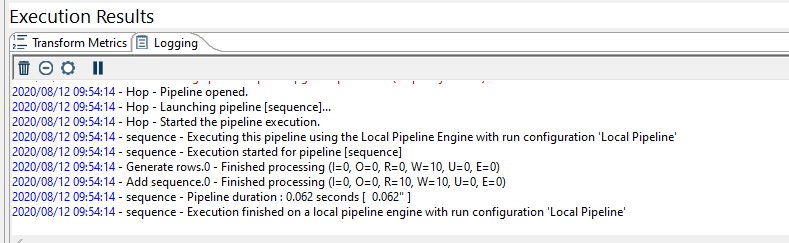
The loggign tab displays the log of the pipeline according to the log level choosen on execution.
Preview a pipeline
Preview the result off a pipeline to see how it performs can be done by completing one of the following tasks:
-
Using the preview
 icon
icon -
Select Run and Preview from the top menu
-
Select Preview from the transform action Menu
-
Click on the tiny bottom right icon after running the transformation

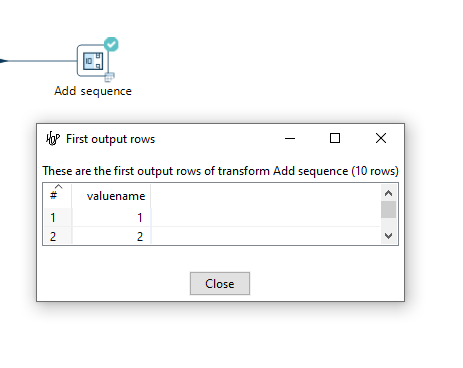
In the pipeline preview dialog the transform from which the result must be previewed can be selected. Furthermore the number of rows to preview can be determined as well as a pause condition. When finished press the Quick Launch button. If you want to change the Pipeline run configuration click Configure. The result is displayed in ascending order. The result is previewed as displayed below.
Debug a pipeline
Debugging a pipeline to eliminate errors can be done by completing one of the following tasks:
-
Using the debug
 icon
icon -
Select Run and Debug from the top menu
-
Select Debug output from the transform action Menu
The same dialog is displayed as when using the preview functionality, only the enabled options are different.
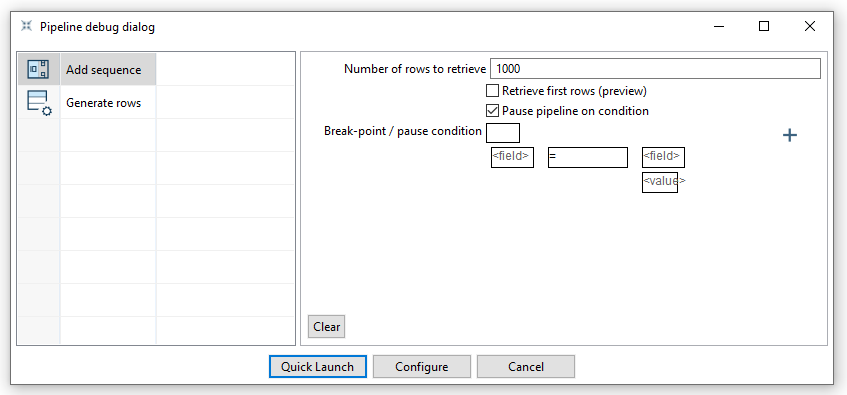
In the pipeline debug dialog the transform from which the result must be debugged can be selected. Furthermore the number of rows can be determined as well as a pause condition. When finished press the Quick Launch button. If you want to change the Pipeline run configuration click Configure. The result is displayed in descending order.