Run, Preview and Debug a Pipeline
Running a Pipeline
Running a pipeline to see how it performs can be done by completing one of the following tasks:
-
Using the Run
 icon
icon -
Select Run and Start execution from the top menu
-
Pressing F8
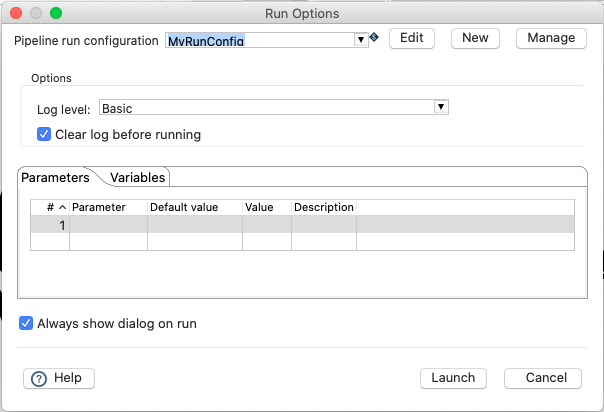
In the pipeline run dialog, hit the 'New' button in the upper right corner to create a new 'Pipeline run configuration'.
In the dialog that pops up, add 'Local Pipeline' as the pipeline configuration name and choose the 'Local pipeline engine' as engine type.
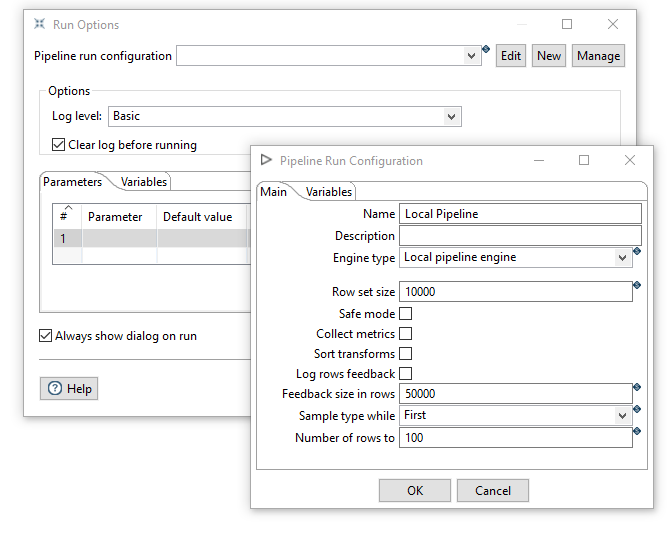
Click 'Ok' to return to the pipeline run dialog.
Choose the logging level as described below.
| LogLevel | Description |
|---|---|
Nothing | Do not record any logging output. |
Error | Only record errors in logging output. |
Minimal | Only use minimal logging. |
Basic | This is the default logging level. |
Detailed | This logging level gives a detailed logging output. |
Debugging | Results in a very detailed output for debugging purposes. |
Row Level | Logging at row level. |
Make sure your configuration is selected and hit 'Launch'.
When a pipeline has run succesfully green check marks are displayed in the right upper corner on the transforms.
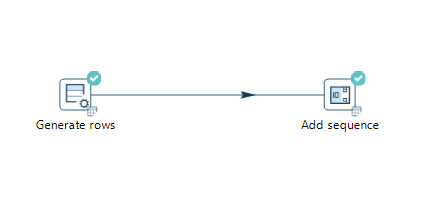
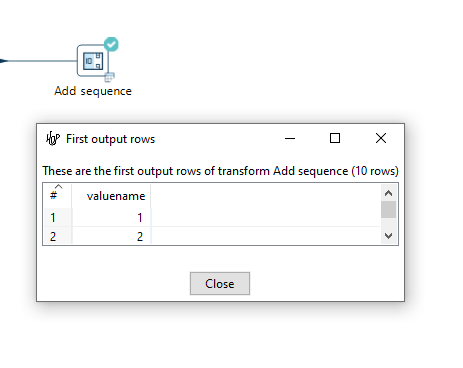
The transforms also show a little table icon, giving you access to a preview of the results of that transform.
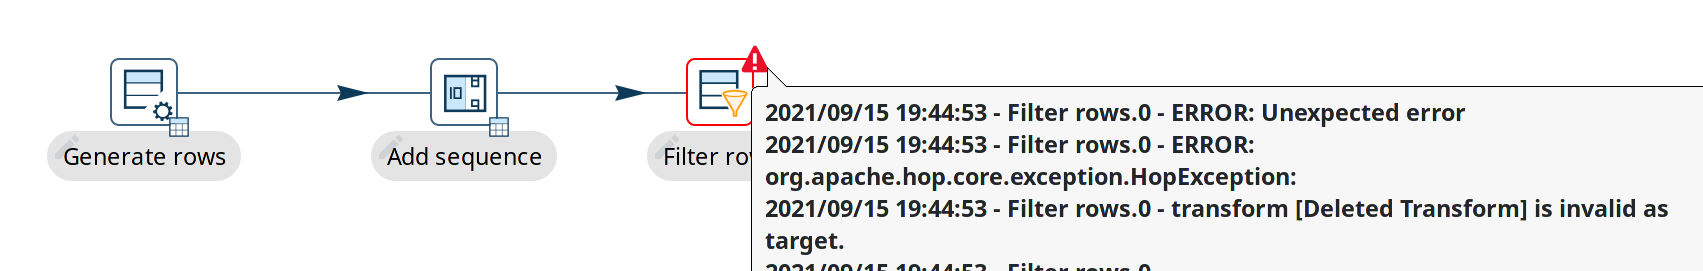
When a pipeline fails, a red triangle is shown in the upper right corner of the failed transform. Hover your mouse over the red error triangle to take a quick peek at the error message. The full stacktrace is available in the logs. Check pipeline error handling to learn about how you can handle errors in your pipeline gracefully (which is not necessarily what you want).
After each run the execution results are displayed in the panel on the bottom of your window. The Execution Results contains two tabs:
-
Transform Metrics
-
Logging
The Transform Metrics tab displays metrics per transform.
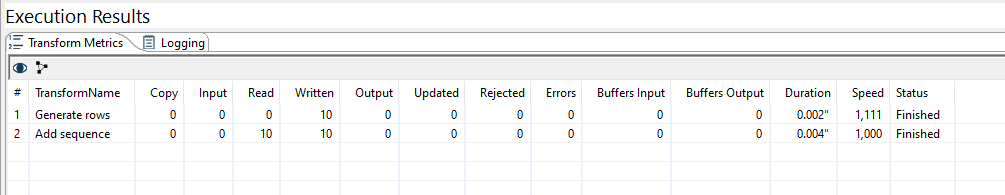
Following metrics are displayed:
| the metrics in this table can be captured and processed in a standard pipeline (e.g to write to a database table or Apache Kafka topic) with a Pipeline Log |
| the metrics available in this table depend on your Pipeline run configuration. The Local pipeline engine always shows these metrics in real-time. |
| Metric | Description |
|---|---|
Copy | The transform copy these metrics apply to. See Specify Copies for more details |
Input | Number of rows read from an input source like files, relational or NoSql databases etc |
Read | Number of rows coming from previous transform |
Written | Number of rows leaving this transform toward next transform |
Output | Number of rows written to an output target like files, relational or NoSql databases etc |
Updated | Number of rows updated by the transform in an output target like files, relational or NoSql databases etc |
Rejected | Number of rows that were rejected by the transform and diverted to an error handling transform |
Errors | Number of errors in the execution of this transform that were not diverted to an error handling transform (marked by a red error triangle on the transform) |
Buffers Input | Number of rows in the input buffer for this transform (can only higher than 0 during execution) |
Buffers Output | Number of rows in the output buffer for this transform (can only higher than 0 during execution) |
Duration | The execution duration for this transform |
Speed | The execution speed in rows per second for this transform. This is close to the number of rows processed (written or output) by this transform divided by the duration (not exact because of rounding in the duration) |
Status | The transform status; Running, Stopped, Finished, |
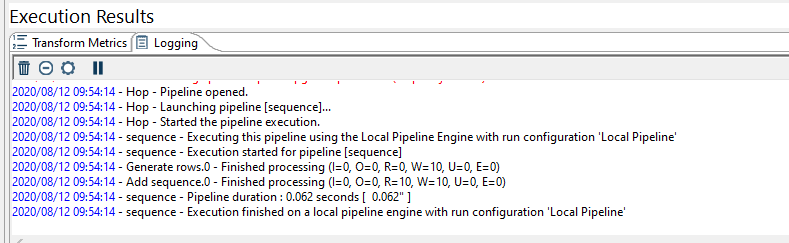
The logging tab displays the log of the pipeline according to the log level choosen on execution.
Preview and debug a pipeline
To inspect pipeline data while controlling how execution pauses, use Preview & debug (toolbar, Run menu, or transform actions). This opens a single dialog for preview rows and optional breakpoint behavior.
You can start it in any of these ways:
-
Using the preview
 icon on the pipeline toolbar
 -
Select Run and Preview & debug from the top menu
-
Select Preview & debug output from the transform action menu
-
Click on the tiny bottom right icon after running the pipeline
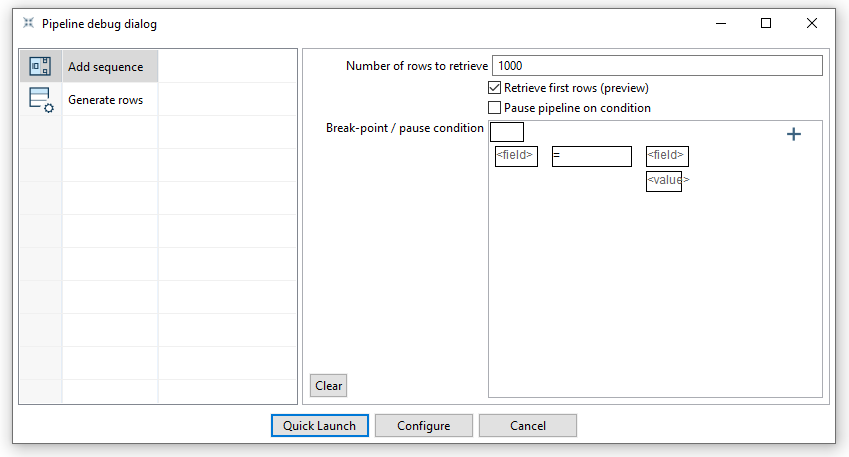
In the dialog, choose the transform whose rows you want to inspect. Set how many rows to retrieve (Retrieve first rows), and optionally enable Pause on breakpoint and define a condition so the pipeline pauses when that condition matches a row. When finished press Quick Launch. To change the pipeline run configuration, click Configure.
The collected rows are shown in the preview window when execution pauses or finishes.